Similar
Atlas and zoogeography of common fishes in the Bering Sea and Northeastern Pacific - M. James Allen, Gary B. Smith (1988) (20350795681)
Summary
Title: Atlas and zoogeography of common fishes in the Bering Sea and Northeastern Pacific / M. James Allen, Gary B. Smith
Identifier: atlaszoogeograph00alle (find matches)
Year: 1988 (1980s)
Authors: Allen, M. James; Smith, Gary B; United States. National Marine Fisheries Service
Subjects: Fishes Bering Sea Geographical distribution.
Publisher: Seattle, WA : U. S. Dept. of Commerce, National Oceanic and Atmospheric Administration, National Marine Fisheries Service ; Springfield, VA : May be obtained from U. S. Dept. of Commerce, National Technical Information Service
Contributing Library: Penn State University
Digitizing Sponsor: LYRASIS Members and Sloan Foundation
View Book Page: Book Viewer
About This Book: Catalog Entry
View All Images: All Images From Book
Click here to view book online to see this illustration in context in a browseable online version of this book.
Text Appearing Before Image:
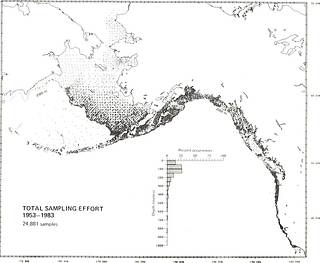
The data from most of the resource surveys represented in the database (and particularly surveys conducted by the RACE Divi- sion) were collected by relatively standard procedures (see Dark et al. 1980; Gunderson and Sample 1980; Parks and Hughes 1981; and Smith and Bakkala 1982 for representative examples). Sam- pling stations were located within a study area in a prearranged pattern, usually a systematic grid. At each station a trawl net was towed, or a fish trap was set, for a standard duration. Fish and in- vertebrates recovered in the sample were identified to the lowest reliable taxonomic level, weighed, and counted. Taxonomic iden- tifications of fishes have generally been made by fishery biologists using the best available field guides and keys, but also by specialists with particular expertise in fish systematics. The principal literature used to identify fishes in the various regions has been Wilimovsky (1958), Hitz (1981), Miller and Lea (1972), Hart (1973), and Eschmeyer and Herald (1983). In surveys conducted by the RACE Division, all standard data were edited and filed with all previous results in the NWAFC's com- puter database at the end of each cruise leg. Database retrievals and analyses The data resources in the NWAFC system are organized into three geographic databases: Bering Sea and Aleutian Islands, Gulf of Alaska, and Pacific Coast (Mintel and Smith 1981). The database for each area has five primary files that include the basic survey data. Two of them, haul and catch files, were used for this study. Haul file data describe the characteristics of each sampling site. At the time of this study, the haul file contained 24,881 records, distributed as follows: Bering Sea and Aleutian Islands 10,697; Gulf of Alaska 10,806; and Pacific Coast 3,378. Catch file data describe the catch information from each survey sample and include a 5-digit species code, weight, and number. There is one record per taxon and usually multiple catch records per haul. The catch file includes more than 330,000 records. In this study, catch data for a particular fish species were first retrieved from each regional database, then associated with the cor- responding haul data, and finally mapped and summarized statistical- ly. The geographic distribution of a species was plotted using three computer programs: STATION; UNDER/PLOT; and MAP (Mintel and Smith 1981). Program STATION was used to select data from the haul file for plotting. Because some species occurred in numerous samples, it was necessary to control overplotting of sta- tions by using program UNDER/PLOT to subdivide all maps into a grid of statistical blocks about the size of a plot symbol, 5' latitude by 5' longitude, and representing all occurrences of stations within a block by a single " + " character. Program MAP was then used to draw an actual map and include 200-m depth contours. The distribution of a species, or a set of stations, with respect to sampling depths was summarized using the FREQUENCIES procedure available in the SPSS statistical package (Nie et al. 1975). This method calculated the total number of occurrences in each 50-m interval of the depth range, e.g., 0-49 m, 50-99 m, 100-149 m.
Text Appearing After Image:
TOTAL SAMPLING EFFORT 1953-1983 24,881 samples Figure 1 Distribution of the total sampling effort.
Note About Images
Please note that these images are extracted from scanned page images that may have been digitally enhanced for readability - coloration and appearance of these illustrations may not perfectly resemble the original work.
Tags
Date
Source
Copyright info


